Part 4: Scale-up - Analyzing Patterns in the Evolution of Linux
evolution%20-%20Image%201-1-Nov-09-2021-04-48-16-25-PM%201.png?width=876&height=604&name=Software%20(r)evolution%20-%20Image%201-1-Nov-09-2021-04-48-16-25-PM%201.png)
In this article we’ll explore how software evolution helps us make sense of large codebases. We’ll use the Linux Kernel as a practical case study. By analyzing patterns in the evolution of the Linux Kernel we’re able to break down million lines of code, authored by thousands of developers, into a set of specific and focused refactoring tasks that are most likely to give you the most bang for your efforts.
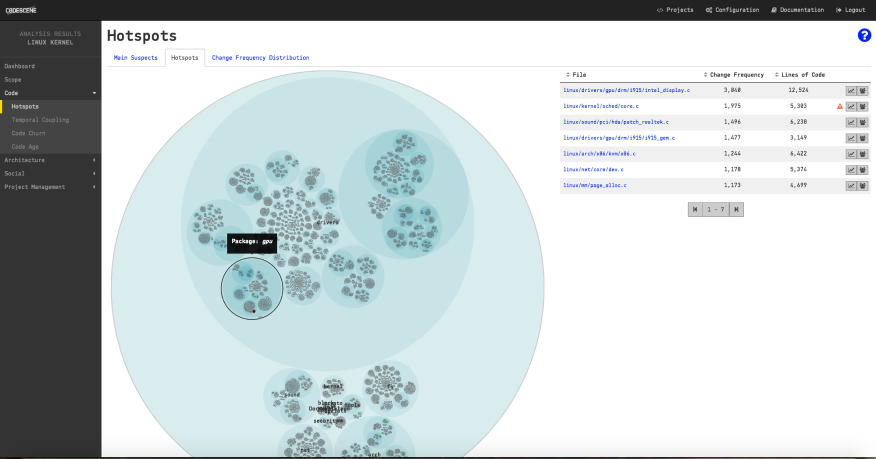
15 Million Lines of Code at a glance - a Hotspot analysis of the Linux Kernel.
Our primary tool for exploring the Linux kernel is a Hotspot analysis. As we’ve learned earlier, Hotspots are complicated code that we have to work with often. We’ll find Hotspots on sub-system-, file- and function-levels. We’ll also learn how we can act upon our findings and use them as a driver to improve. Before we go there I’d like to talk a bit about the challenges of a large-scale codebase like Linux as a motivation to why it’s important to support decisions with data.
Is Software too Hard for us?
I spent six years of my career studying psychology at the university. During those years I also worked as a software consultant, which gave me the opportunity to relate the two fields. People I worked with knew about my studies (how could they not - I probably talked non-stop about brains, odd experiments and unexpected social biases) and were curious about psychology. The single most common question I got was why it was so hard to write good code. But I’d like to re-frame the question; The more I learned about cognitive psychology, the more surprised I got that we’re able to code at all. Given all the cognitive bottlenecks and biases of the brain, coding should be too hard for us. The human brain didn’t evolve to program.
Of course, even if programming should be too hard for us, we do it anyway. The reason we manage to pull this off is because we humans are great at workarounds. A lot of the practices we use to structure code are tailor made for this purpose. For example, abstraction, cohesion and good naming help us stretch the amount of information we can hold in our working memory. We use similar mechanisms to structure our code at a system level; Functions are grouped in modules, modules are aggregated into sub-systems that in turn are composed into a system.
But even when we manage to follow all these principles and practices, large codebases still present their own set of challenges. Take Linux as an example. The current kernel consists of +15 million lines of code and grows at a rapid rate. I’ll go out on a limb here and claim that there are few people in the world who can fit 15 million lines of code in their head and reason efficiently about it. In addition, a system under active development presents a moving target; Even if you knew how something worked last week, that code might have changed twice since then. Detailed knowledge in the solution domain gets outdated fast.

The Linux Kernel has more authors than what GitHub is able to count - what are the coordination costs on such projects?
The picture becomes even more complex once we add the social dimension of software development. As a project grows beyond 15-20 developers, coordination, motivation and communication issues tend to give a significant overhead. We’ve known that since Fred Brooks wrote The Mythical Man-Month, yet we, as an industry, are still not up to the challenge. For example, we have tons of tools that let us measure technical aspects like coupling, cohesion and complexity. While these are all important facets of a codebase, it’s often even more important to know if a specific part of the code is a coordination bottleneck. And in this area supporting tools have been sadly absent.
I set out to change that by dedicating a whole part in Your Code As A Crime Scene to the topic of Master the Social Aspects of Code. Now we’ll apply some of those techniques to the Linux Kernel. Anything we can do to lower the bar of entry and provide an up-to-date overview of such a massive codebase is a huge win.
Divide and Conquer Legacy Code with Hotspots
My first step is to run an analysis with CodeScene. CodeScene is a tool that analyzes the evolution of a codebase. All I have to do is point CodeScene to the GitHub mirror of the Linux repository and press play. Since I don’t have any previous knowledge of the Linux codebase, I chose to analyze the complete history of the code to get an overview. In this case, we get every commit since early 2006 when Linux Git history starts:

CodeScene's dashboard for the analysis of the Linux Kernel.
We noted earlier that GitHub gave up on counting the number of authors in Linux. In the CodeScene dashboard above we see that Linux has more than 15.000 contributors! We also see that there are more than half a million commits (CodeScene filters away merge commits by default) and that the majority of the code is, surprise, surprise, written in C with +14 million lines of code.
I’ve analyzed commercial systems of similar scale with CodeScene, but those closed source codebases never had that much development activity. Linux is indeed a unique snowflake. Trying to make sense of all that data requires a strategy. On large-scale systems divide and conquer has served me well. Here’s what I do when faced with a large legacy codebase:
- Run an analysis on the complete codebase to spot overall trends and implicit dependencies.
- Identify the architectural boundaries. Sometimes those boundaries are documented. If not, I try to reverse engineer them based on the folder structure of the codebase.
- Run a Hotspot analysis on an architectural level to identify the components with most development effort.
- Finally I setup separate Projects for each significant architectural component. This is straightforward since CodeScene lets me specify a set of white list glob patterns for each analysis Project. So let’s say we want an analysis of just the GPU driver. I’d create a new configuration and white list all content that matches
linux/drivers/gpu/**.
The reason I split a large codebase into multiple analysis projects is because each sub-system will have a different audience. People tend to specialize. My goal here is to partition the analysis information on a level where each analysis result is tailored to the people working on that part.
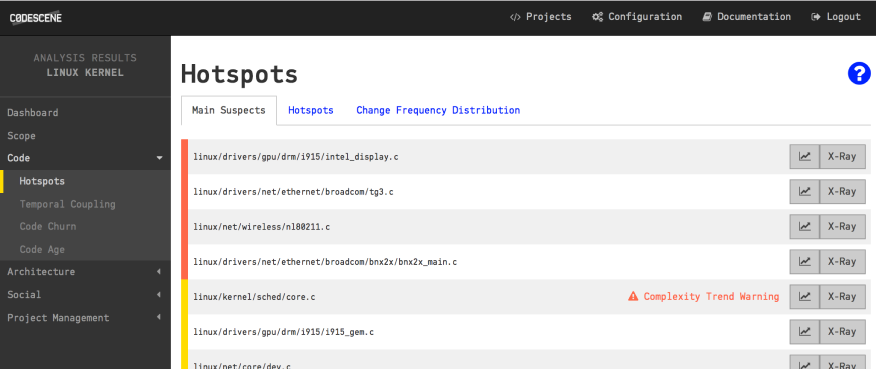
The main suspects in terms of maintenance effort on a system-level. When we divide and conquer, CodeScene uncovers the main suspects of each sub-system too.
There’s another advantage with separate analysis projects. CodeScene helps us prioritize the code we need to inspect (and probably improve) by applying machine learning algorithms that look for deeper patterns. This prioritized code, our Main Suspects as shown in the figure above, is always relative to the rest of the code. With separate and focused analysis projects we get prioritized Main Suspects for each sub-system. Let’s see how we do this.
Find the Architectural Hotspots in Linux
CodeScene lets you configure your architectural components and sub-systems using a simple pattern language. In this case I provided a one to one mapping of the top level source code folders to components. However, since I noted in the initial Hotspot analysis that the drivers package is huge, I chose to split it into several components as well. So for drivers, I map each of its sub folders to a unique component.
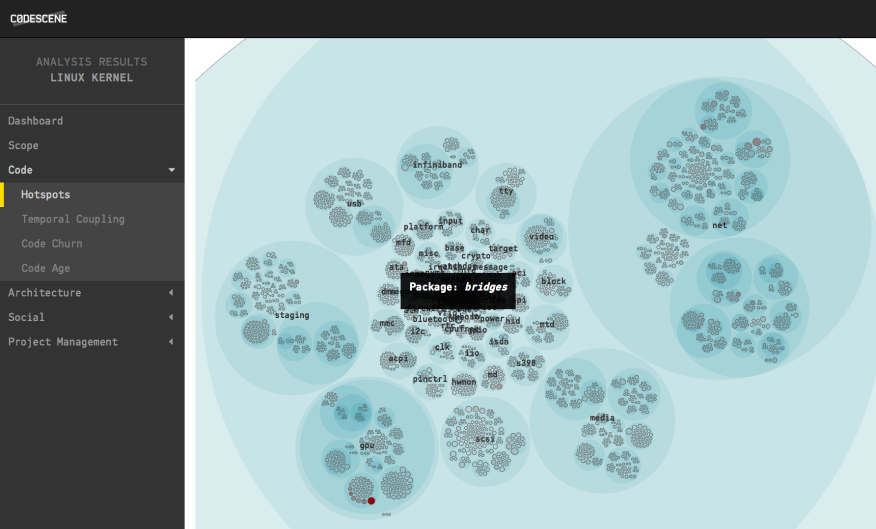
A Hotspot analysis zoomed in to view the content of the drivers package. Each folder becomes an architectural component in the analysis.
Once we’ve defined the architectural boundaries we just kick-off a new analysis. Only this time we limit the analysis period to the evolution over the past year to avoid having historic data that obscures more recent trends. Now we just have to wait for the analysis to finish. Ok, here we go:
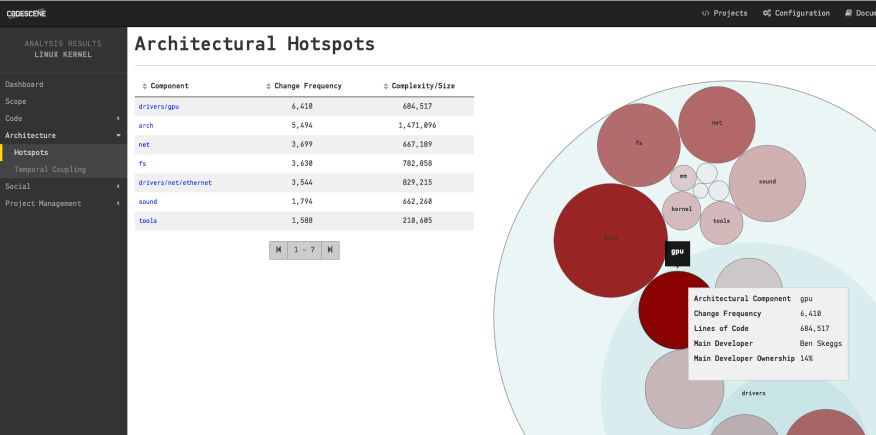
The architectural Hotspots in Linux during 2016.
As you see in the picture above, the top architectural Hotspot in Linux is the drivers/gpu package. That means the Linux authors have spent most development effort during 2016 on code inside that package. Armed with this information I configure an analysis of just the GPU component by white listing its content. Once that analysis finishes we’re down to a much more manageable amount of code for our investigation. Let’s start by investigating the architectural trends of the drivers/gpu package content:
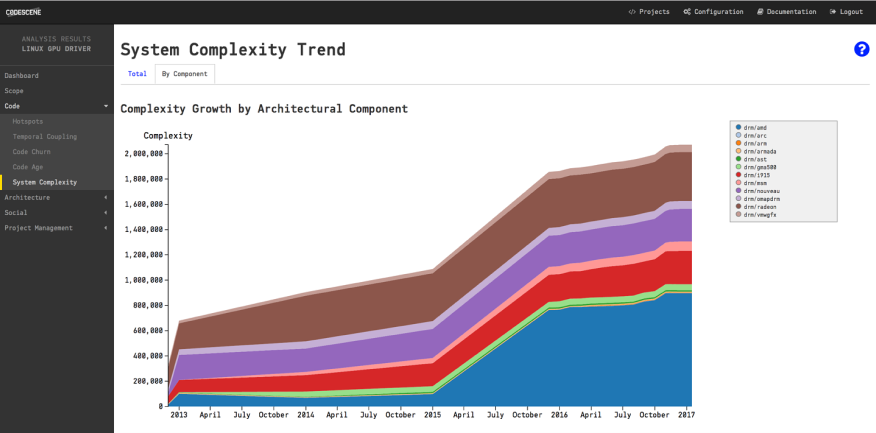
The accumulation of complexity on an architectural level.
As you see in the stacked area chart above, there is a significant growth in this sub-system. The amd package in particular exhibits a dramatic increase. We could use this information to configure even more specific analyses, but based on my experience we should already be on a level of scale where we can act. Let’s look at the overall numbers for the drivers/gpu package:

A separate analysis of the content under drivers/gpu, which is our main architectural hotspot.
An interesting result here is that the Main Suspects in drivers/gpu only make up 1.4% of the code, but those 1.4% attract 15.9% of all commits. That part of the code is where our primary refactoring candidates are. Let’s look inside the drivers/gpu component to reveal the top Hotspots on a file level:
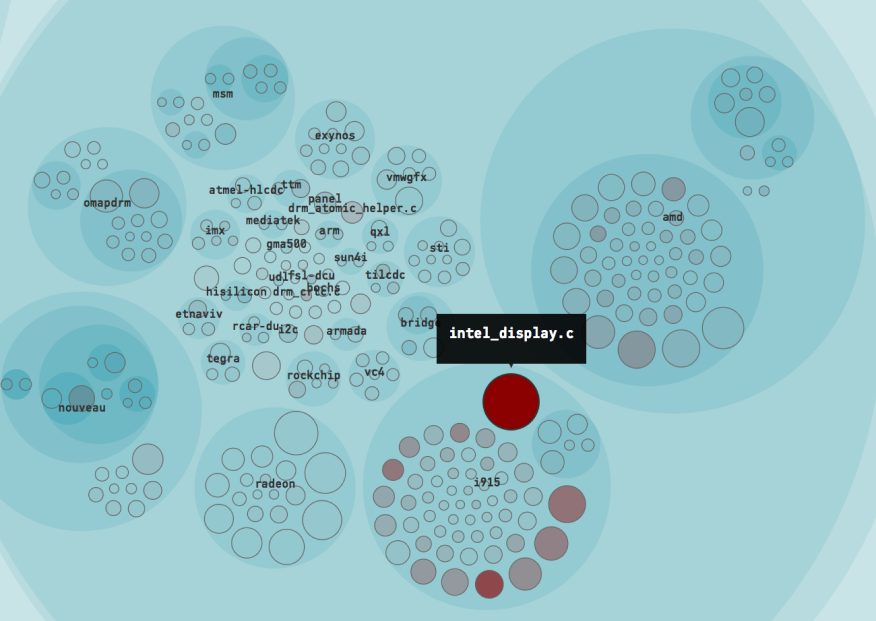
The file intel_display.c is the top Hotspot in Linux during 2016.
This is an interesting finding: the file intel_display.c is our top Hotspot based on the evolution of Linux during 2016. If you paid close attention you probably heard an alarm go off; intel_display.c was also our main suspect as we explored the complete Git history of Linux initially. That is, the same file that is a Hotspot in the recent development history has been a Hotspot over the past decade too.
Now, let’s explore the implications of that and see how we can get information we can act upon.
Inspect your Main Suspects
So what does it mean when a file is identified as a “Hotspot”? Is that necessarily a bad thing? No, it isn’t, although there’s usually a correlation here. A Hotspot just means that we’ve identified a part of the code that requires our attention. The more often something is changed, the more important that this something is of high quality. So our next step is to find out how intel_display.c, our main suspect, evolves over time. Does is change a lot because we make improvements to it? Or is it code that keeps degrading in quality?
A Complexity Trend analysis let us answer these questions. In a complexity trend analysis, we pick each historic revision of the Hotspot, measure the code complexity at that point in time, and plot a trend. The analysis is run automatically by CodeScene. Here’s how it looks on intel_display.c:
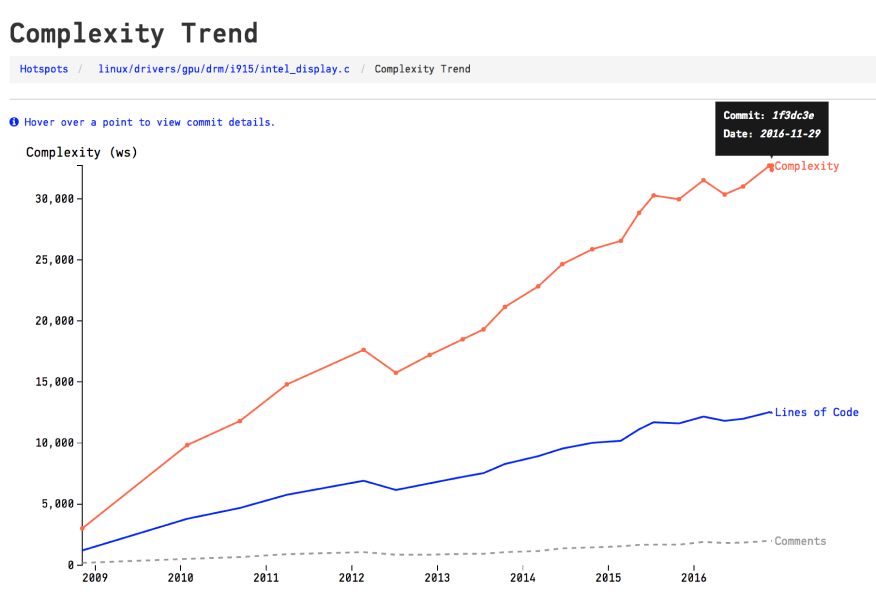
A complexity trend analysis reveals that the file intel_display.c has kept on accumulating complexity for years.
Before we move on I just want to tie back to my earlier claim that Linux was a unique snowflake in terms of development activity. Remember that? However, our Hotspot investigation reveals that Linux evolves like most other codebases: most Hotspots tend to stay where they are and they also keep accumulating complexity over time. Most code doesn’t get refactored and our intel_display.c is just one example out of many.
At this point I’d claim that we have all the information we need to suggest a refactoring of our main suspect: It’s a large unit, we need to change the code often, and as we do so we keep adding even more complexity to the code, which makes it harder and harder to understand.
Now, let’s pretend for a moment that this was your project and that you agree with the analysis result. Where would you start your refactorings? We see that intel_display.c consists of 12.500 lines of C code (comments and blanks stripped away). A file of that size becomes like a system in itself. Parts of the code have probably been stable for years while others keep changing. We want to focus on the latter. This is precisely what CodeScene’s X-Ray analysis does. We saw X-Ray at work in a previous part of this series. Now we’ll put it to work on our Hotspot in Linux.
X-Ray the Main Suspects
CodeScene’s X-Ray analysis runs the same Hotspot algorithm as we’ve already seen. The difference is the scope. X-Ray operates on a function level to detect Hotspot functions inside Hotspot files. That means we get to use the same analysis concepts as we travel down the abstraction levels of out codebase. Let’s see what X-Ray reveals about intel_display.c:
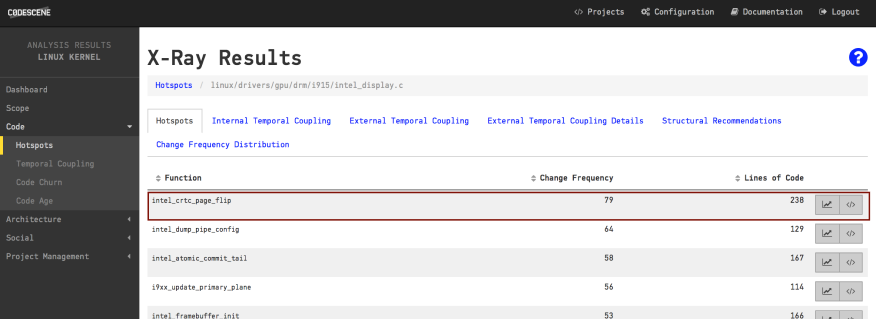
The Hotspots on function level inside intel_display.c serve as a prioritized list of refactoring candidates.
As you see in the figure above, X-Ray ranks the functions based on how often you’ve made modifications to them. In most cases, this information serves as a prioritized list of refactoring candidates. Sure, there may be severe structural problems with a Hotspot, but in a large system with Hotspots consisting of thousands of lines of code you need to start somewhere. Refactoring that kind of code has to be an iterative process; The first refactoring addresses the most critical piece of code in terms of maintenance effort, then you move on to the next target in the list. After a series of such refactorings you’re likely to discover new design boundaries and can continue from there.
A Periodical Reminder That All Code Isn’t Equal
Back in the first part of this series I showed that the change distribution of code, on a file level, follows a power law shape. We learned that’s the reason why Hotspots serve so well as a tool to prioritize. Now that we’ve met X-Ray we can see that the modifications of individual functions inside a file also tend to form a power law:ish distribution. As an example, here’s the distribution of changes across the functions in our intel_display.c:
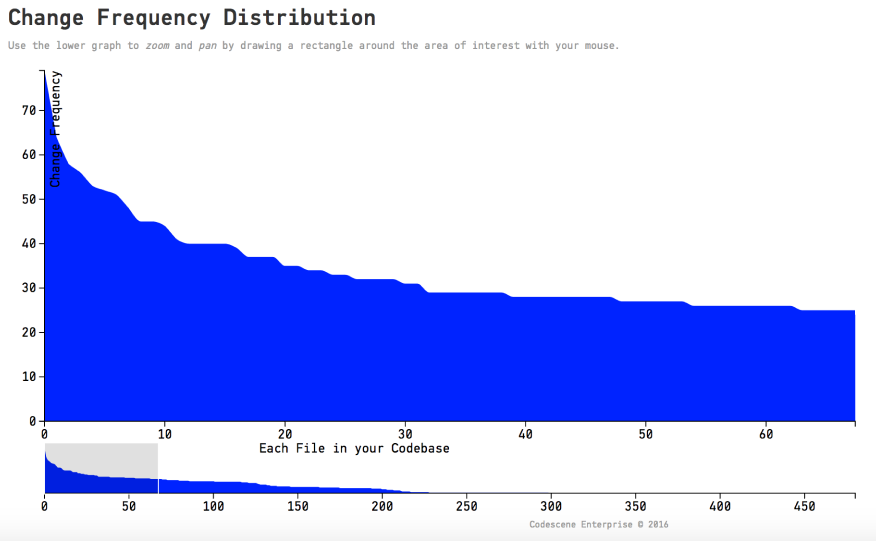
X-Ray reveals that most modifications to existing code are unevenly distributed across the functions in a file.
This is why I recommend that we guide our refactorings by data. Data that is based on our own behavioral patterns in code. You see, refactoring legacy code is both expensive and high risk. With X-Ray as our guide we know that we spend our efforts where they are likely to be needed the most.
Find Implicit Dependencies Between Functions
After this detour into a discussion of change frequency distributions we may still struggle with the refactoring of our main Hotspot. I briefly mentioned that Hotspots often have structural problems. In my previous blog post I showed how X-Ray detects patterns in how a Hotspot grows. More specific, I showed how temporal coupling lets you identify the functions in a Hotspot that tend to be modified together in the same commit. A temporal coupling analysis like that may help you detect some structural problems. Let’s see how it looks on our intel_display.c.
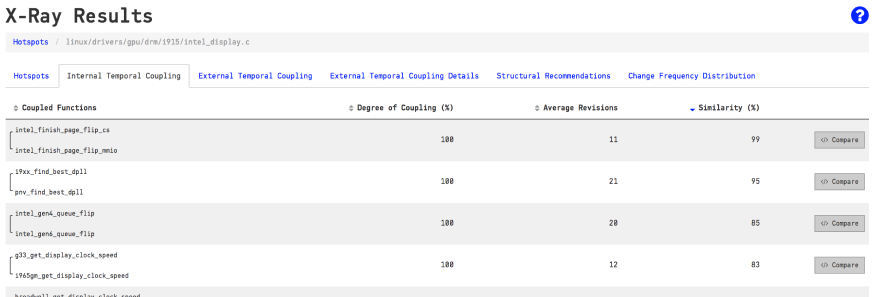
X-Ray detects how often the functions inside a Hotspot are modified in the same commit.
As you see in the picture above, there are several functions inside intel_display.c that are modified together all the time. For example, the top row shows that intel_finish_page_flip_cs and intel_finish_page_flip_mmio have been modified together in every single commit that touched one of them. That implies that these two functions are intimately related.
The Similarity column in the table above is a clone detection algorithm. You see, a common reason that code changes together is because it contains duplication (either on the code level or in terms of knowledge). In our case, we note a similarity of 99% between the functions intel_finish_page_flip_cs and intel_finish_page_flip_mmio. Let’s click on the Compare button in CodeScene to inspect the code:
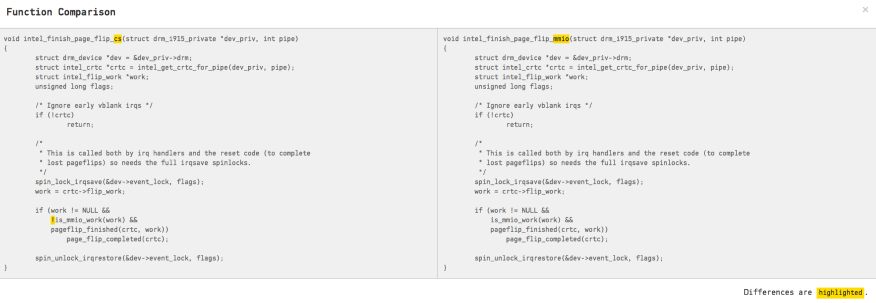
X-Ray detects software clones inside a Hotspot.
You need to look carefully at the code above since there’s only a single character that differs between the clones. A single negation(!) is all the difference there is. That leaves us with a clear case of code duplication. We also know that the duplication matters since the temporal coupling tells us that these two clones evolve together. Software clones like these are good in the sense that it’s a low-hanging fruit; Factor out the commonalities and you get an immediate drop in the amount of code you have in your Hotspot.
Rinse and Repeat for your Main Suspects
Once we’ve inspected our top Hotspot we just rinse and repeat the process with the other main suspects. And here you’ll note another advantage of configuring separate analyses for the different sub-systems. Inspecting a Hotspot is so much easier if you’re familiar with the domain and the code. So if we manage to align the scope of the analysis with the expertise of the team that act upon them we’re in a good place.
This is something I experience each time I present an analysis of a commercial codebase to its developers. As I present the Hotspot analyses of the different parts of the codebase I usually get approving nods from different parts of the audience depending on their area of expertise. Hotspots put numbers on your gut feelings.
Explore the Social Dimension of Software Design
So far we’ve learned the basics of how software evolution helps us uncover potential technical problems in a large codebase. But software evolution also helps you understand the social dimension of code. Since CodeScene uses version-control data for the analyses, CodeScene is able to detect patterns in how people work and collaborate.
Now, there’s a difference between the open source model used in the Linux project as compared to the collaboration mechanisms you usually see in closed source commercial projects. In the latter case you typically have several distinct teams, often co-located on the same site. And improving the coordination and communication between these teams is often even more important than addressing the immediate technical debt in your code.
CodeScene comes with a set of analyses that help you uncover such team-productivity bottlenecks. An example is code that has to be concurrently worked on by members of different teams. Since the Linux project doesn’t have a formal organization we’ll limit our social analyses to individuals.
Detect Excess Parallel Development
The way we chose to organize influences the kind of code we write. There’s a strong difference between code developed by a single individual versus code that’s more of shared effort by multiple programmers. The quality risks are not so much about how many developers that have to work with a particular piece of code; It’s more about how diffused their contributions are.
In Your Code As A Crime Scene I wrote that “[..]the ownership proportion of the main developer is a good predictor of the quality of the code! The higher the ownership proportion of the main developer, the fewer defects in the code”.
Again, open source development may be different and encourage contributions to all parts of the code. However, there’s evidence that suggests that this comes with another cost. One study on Linux itself claims that code written by many developers is more likely to have security flaws (A. Meneely & L. Williams, 2009. Secure open source collaboration: an empirical study of Linus’ law). Wouldn’t it be great if we had an analysis that helps us identify those parts of the code?
Detecting code written by many developers is precisely what CodeScene’s Parallel Development analysis does. In particular, it doesn’t look at the number of authors, but on how diffused their contributions to each file are. Let’s see it in action:
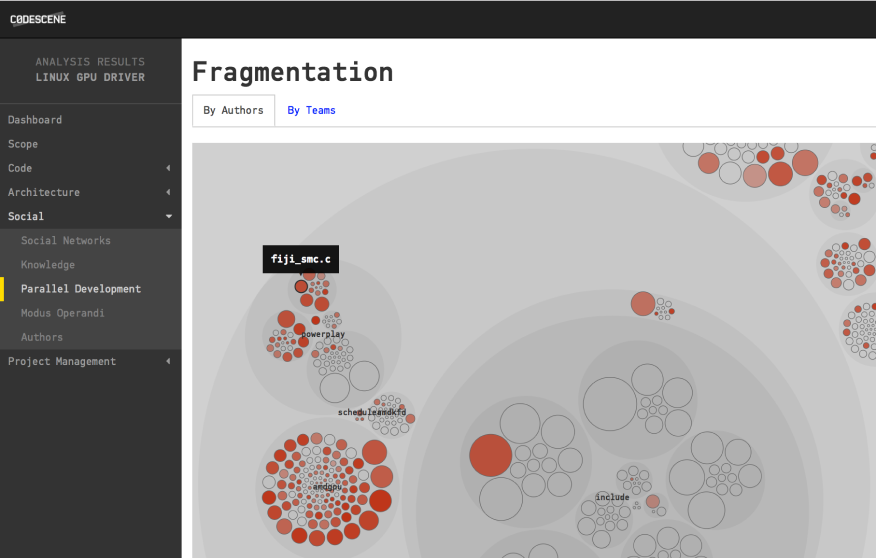
A Parallel Development analysis shows you code that's modified by many authors.
You interpret the visualization above by looking at the color of each file; The more red, the more diffused work on that code. And if you’d like more information, you just click on one of the files to reveal its Fractal Figure;
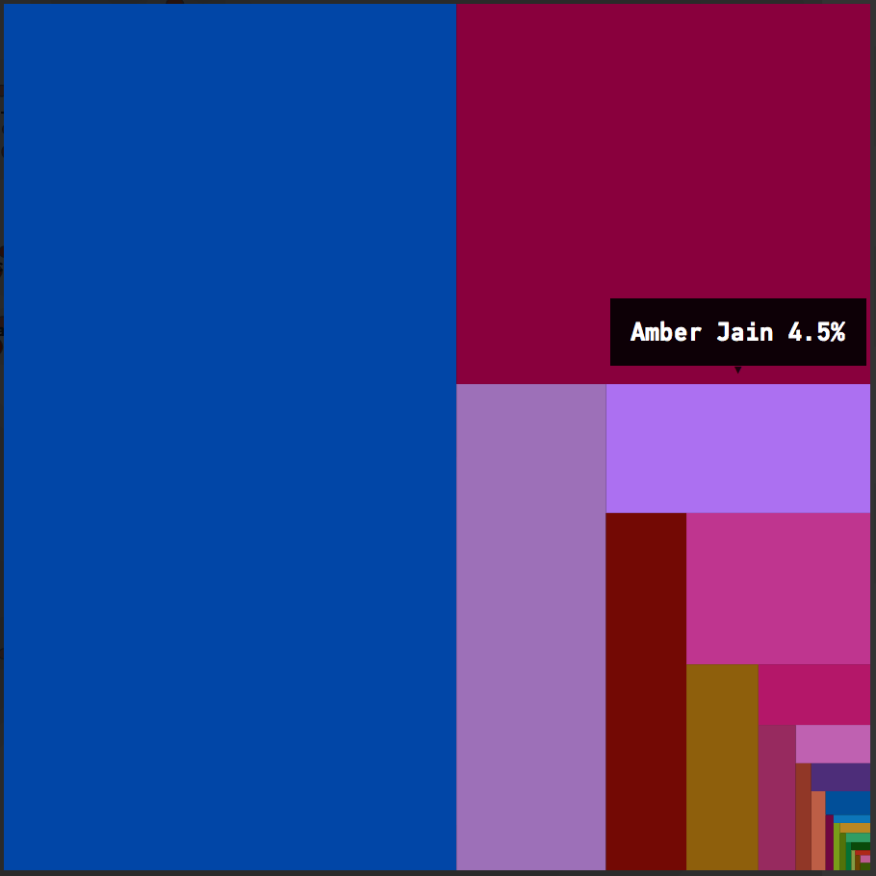
Fractal Figures shows the diffusion of the contributing authors' work on a single file .
The Fractal Figure above is based on a simple model; Each developer is assigned a unique color and the more that developer has contributed to the code, the larger their area of the fractal.
Embrace the History of your Code
This concludes our exploration of the evolution of the Linux codebase for this time. My goal was to show you how to make sense of a large codebase by utilizing the information of how the system was built. By embracing the history of the code, we were able to identify patterns like Hotspots and implicit dependencies. That is, information that is invisible in the code itself. We also had a brief look at how we can uncover social and organizational information that helps us understand another important dimension of large-scale systems.
Run the Analyses on Your Own Codebase
The best way to learn more is to try CodeScene on your own codebases. CodeScene is available as a service that’s free for open source projects: https://codescene.io/.
Empear also provides CodeScene on-premise. The on-premise version is feature complete with all analyses used in this article. You get an on-premise version here.
Read the Earlier Parts of the Series
Software (r)Evolution is a series of articles that explore novel approaches to understanding and improving large-scale codebases. Along the way we’ll use modern data science to uncover both problematic code as well as the behavioral patterns of the developers that build your software. This combination lets you to identify the parts of your system that benefit the most from improvements, detect organizational issues and ensure that the suggested improvements give you a real return on your investment.

